Top menu

The top menu is present at any time and contains icons that provide means to:
  • Return to the home-page
  • Display a map geolocalizing populations present in the database
  • Upload genotyping data for new individuals, perform PCA with WIDDE individuals and population assignment
  • Log in and out
(Authenticated users may have access to additional, private data)

Selection of individuals

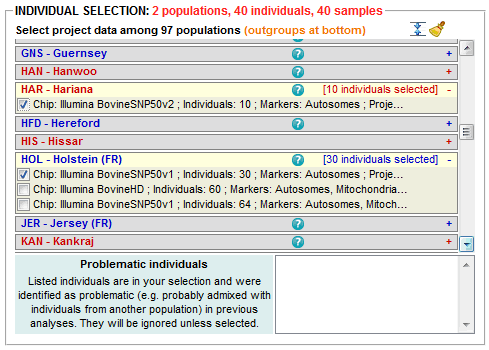
This box lets you select individuals in the database. To do so, click on population names to see which sets of individuals are available for each of them (several sets are available for a given population when it was involved in several projects). Mousing-over a set of individuals provides additional details. Selection is summed up automatically at the top of the box, in red characters.

Some individuals may have been marked as problematic for some reason. They are excluded by the default but the list at the bottom allows you to force the system to include them in your selection. The reason why there were marked as problematic is displayed when you mouse-over them.

The following icons have the following functions:
Batch-select individuals genotyped on one or several SNP chip(s) (Illumina BovineSNP50v1, IlluminaSNP50v2 and Illumina Bovine HD) and individuals that belong to one or several population group(s) (European taurine, African taurine, Zebu, Hybrid and Outgroup)
Clear out selection
Hide unselected populations
Show unselected populations
Display details about a given population (in a separate window)

Selection of markers

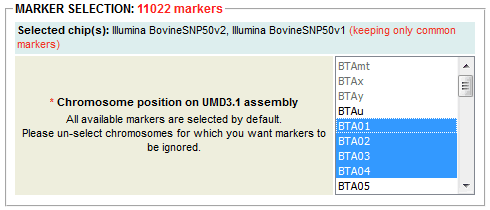
This box lets you select markers in the database. It appears after a valid selection has been made in the previous box and provides a summary of the genotyping technologies (i.e. chips) involved.

Then the "DNA location" list provides the mean to select a combination of chromosomes, and/or mitochondrial DNA. Mitochondrial DNA and sex chromosomes may be grayed out depending on their availability or level of privacy. All available DNA locations are selected by default.

Selection is summed up automatically at the top of the box, in red characters.

Quality filtering

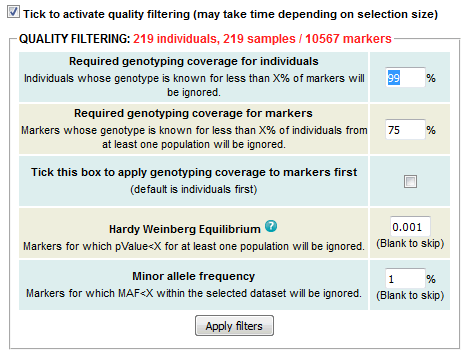
This box lets you apply quality filters to the selected individuals and markers. It appears when a valid selection has been made in the two first boxes. Disabled by default, it is automatically reset when data selection changes.

Genotyping coverage is applied in two successive steps (individuals and markers), the order of which can be reversed by clicking the checkbox in the third row.

Optional filters include Hardy-Weinberg Equilibrium test and Minor Allele Frequency threshold. They are the most time-consuming and can be skipped by clearing-out the corresponding fields.

At the end of the filter application process, its result is summed at the top of the box, in red characters.

Display details about how HWE test is applied

Progress indicator

This area appears when a valid selection has been made in the two first boxes and displays progress indicators about processes that may take time (filter application, data export).

Data export

This area appears when a valid selection has been made in the two first boxes and lets you export the selected dataset, or directly use it to perform an online PCA.

The "SNP IDs" (Illumina, Refseq, WIDDE and Internal) list lets you select the type of IDs to export. The "Export format" list lets you choose from a range of widely-used formats (plink, eigenstrat, hapmap).

Display details about export procedure or how PCA is applied

Online PCA

When the "Perform PCA on selection" button is clicked, a new window opens, in which you can see the procedure progress as follows:
  • Conversion of selected data to Eigenstrat format
  • Job submission for smartpca on computer cluster (may involve a queuing delay)
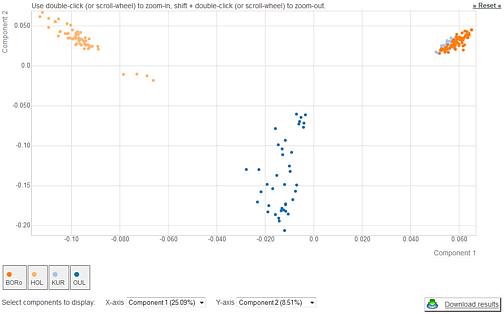
  • Interactive display of PCA result
As this step may take time (few to few dozens of minutes depending on the size of the dataset and the cluster queue status), users have the possibility to enter their email address to be informed of the job completion.
The interactive PCA display provides the following functionalities:
  • Component selection
  • Plot zooming
  • Individual identification by mousing-over dots
  • Toggling display of populations (no re-calculation induced)
  • Downloading PCA results: (i) summary of data selection, (ii) marker_ID _info, (iii) genotyping data in eigenstrat format and (iv) .eval, .evec and stdout files obtained with smartpca.

User's genotyping data exploration and population assignment

Upload user's genotyping data and perform population assignment
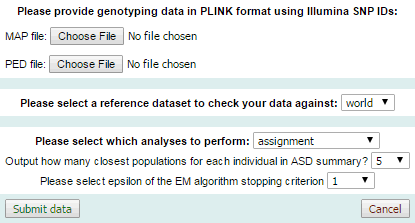
When the "Upload data to assign individuals to WIDDE populations" button is clicked, a dialog box opens, in which user may:
  • upload his own genotyping data in plink format (map and ped files)
  • select a reference dataset to compare his data with (only "world" is currently supported)
  • select analyses to perform (assignment / PCA / both), knowing that population assignment process includes allele sharing distance (ASD) calculation and estimation of ancestry proportions using supervised hierarchical clustering.
User also has to select how many best matches he wants for ASD calculation step (5 or 10) and a value for the ε convergence criterion (0.01, 0.1 or 1). When the "Submit" button is clicked, a new window opens, in which you can see the procedure progress on the computer cluster. As this step may take time, users have the possibility to enter their email address to be informed of the job completion. After the job completion, it is possible to download results:
  • PCA results (see Online PCA)
  • assignment results: (i) merged dataset including user's and WIDDE genotyping data, (ii) ancestry_results and ancestry_summary files from supervised hierarchical clustering, (iii) ASD results and ASD summary results.
NB:
  • Uploaded data must be in PLINK format, providing genotypes as nucleotides, and may not exceed a total of 20 individuals
  • Sample data may be downloaded here: test.map - test.ped